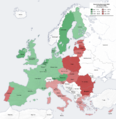
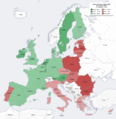
File:EU GDP 2007 it.png

Dimensioni di questa anteprima: 560 × 599 pixel. Altre risoluzioni: 224 × 240 pixel | 449 × 480 pixel | 718 × 768 pixel | 957 × 1 024 pixel | 2 000 × 2 140 pixel.
File originale (2 000 × 2 140 pixel, dimensione del file: 474 KB, tipo MIME: image/png)
Cronologia del file
Fare clic su un gruppo data/ora per vedere il file come si presentava nel momento indicato.
| Data/Ora | Miniatura | Dimensioni | Utente | Commento | |
|---|---|---|---|---|---|
| attuale | 19:09, 14 dic 2013 |  | 2 000 × 2 140 (474 KB) | T,C&S | 2012 data updated by European Commission |
| 17:49, 17 nov 2013 | 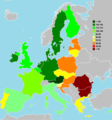 | 2 000 × 2 140 (474 KB) | T,C&S | Updated to 2012 data | |
| 00:42, 14 dic 2012 |  | 2 000 × 2 140 (559 KB) | T,C&S | Updated to 2011, GDP PPA in percentage of EU average | |
| 19:36, 24 apr 2011 |  | 2 000 × 2 140 (559 KB) | T,C&S | Updated to 2010 - IMF data | |
| 19:14, 30 dic 2006 | 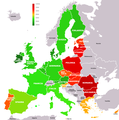 | 1 236 × 1 245 (79 KB) | Fabio Bettani | Map of the European Union with different colours according to the countries' GDP PPP per capita, according to the IMF's predictions for 2007. See www.imf.org. Italian version. Blank version: Image:EU GDP 2007.png. |
Pagine che usano questo file
La seguente pagina usa questo file:

